
Last update images today Decoding The US TV Market Map: A Viewers Guide
Decoding the US TV Market Map: A Viewer's Guide
Introduction: Understanding the US TV Markets Map
Ever wonder why some shows are only available in certain areas or why local news seems hyper-focused on specific towns? The answer lies in the US TV markets map, a geographical division that shapes the television landscape you experience. This guide dives into the intricacies of the US TV markets map, explaining its purpose, how it affects you, and why it's still relevant in the age of streaming. Whether you're a casual viewer or a media professional, understanding this map provides valuable insight into the world of television.
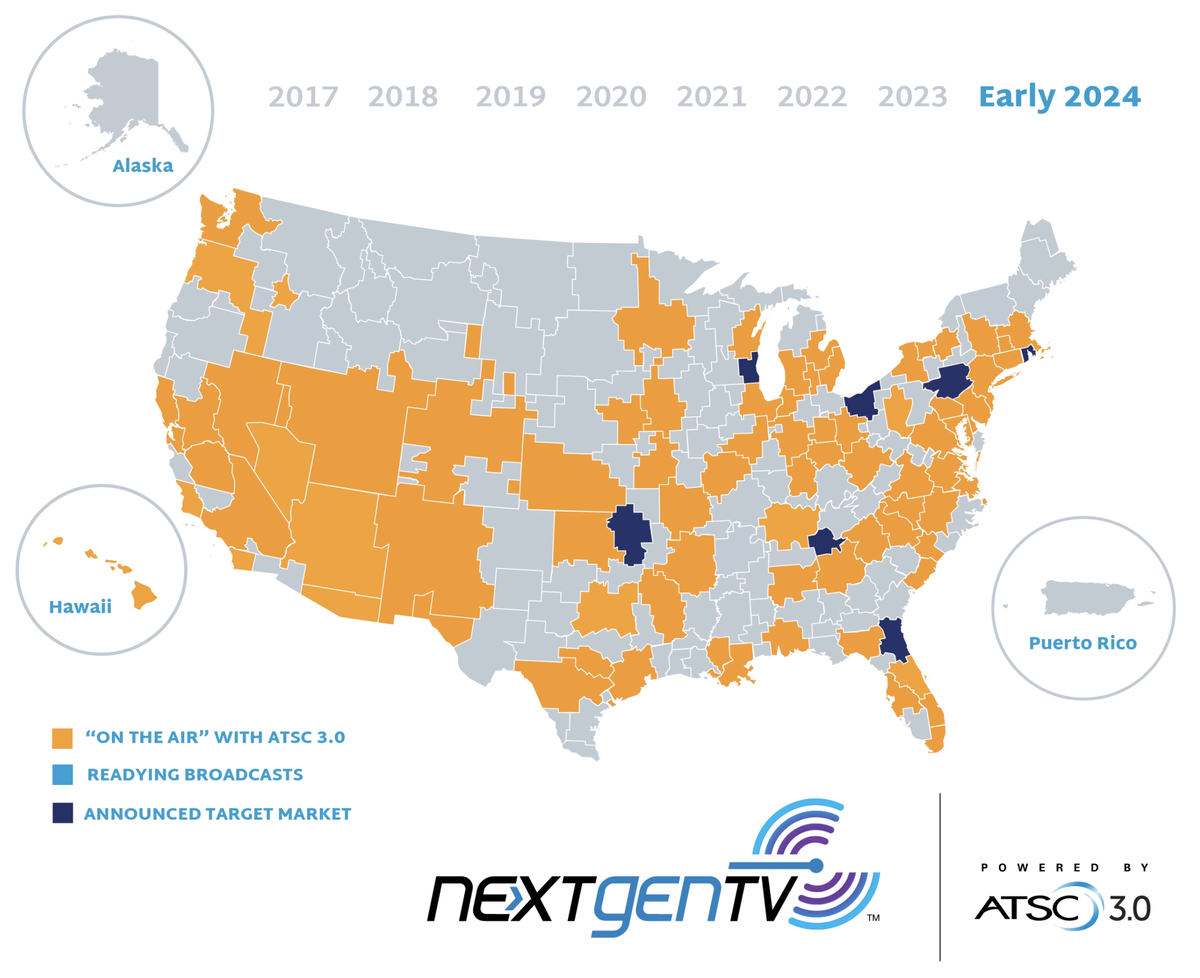
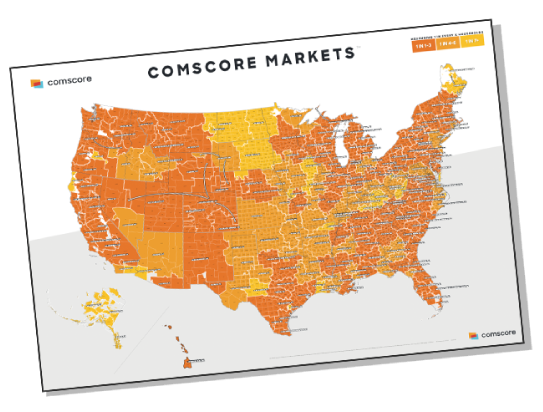
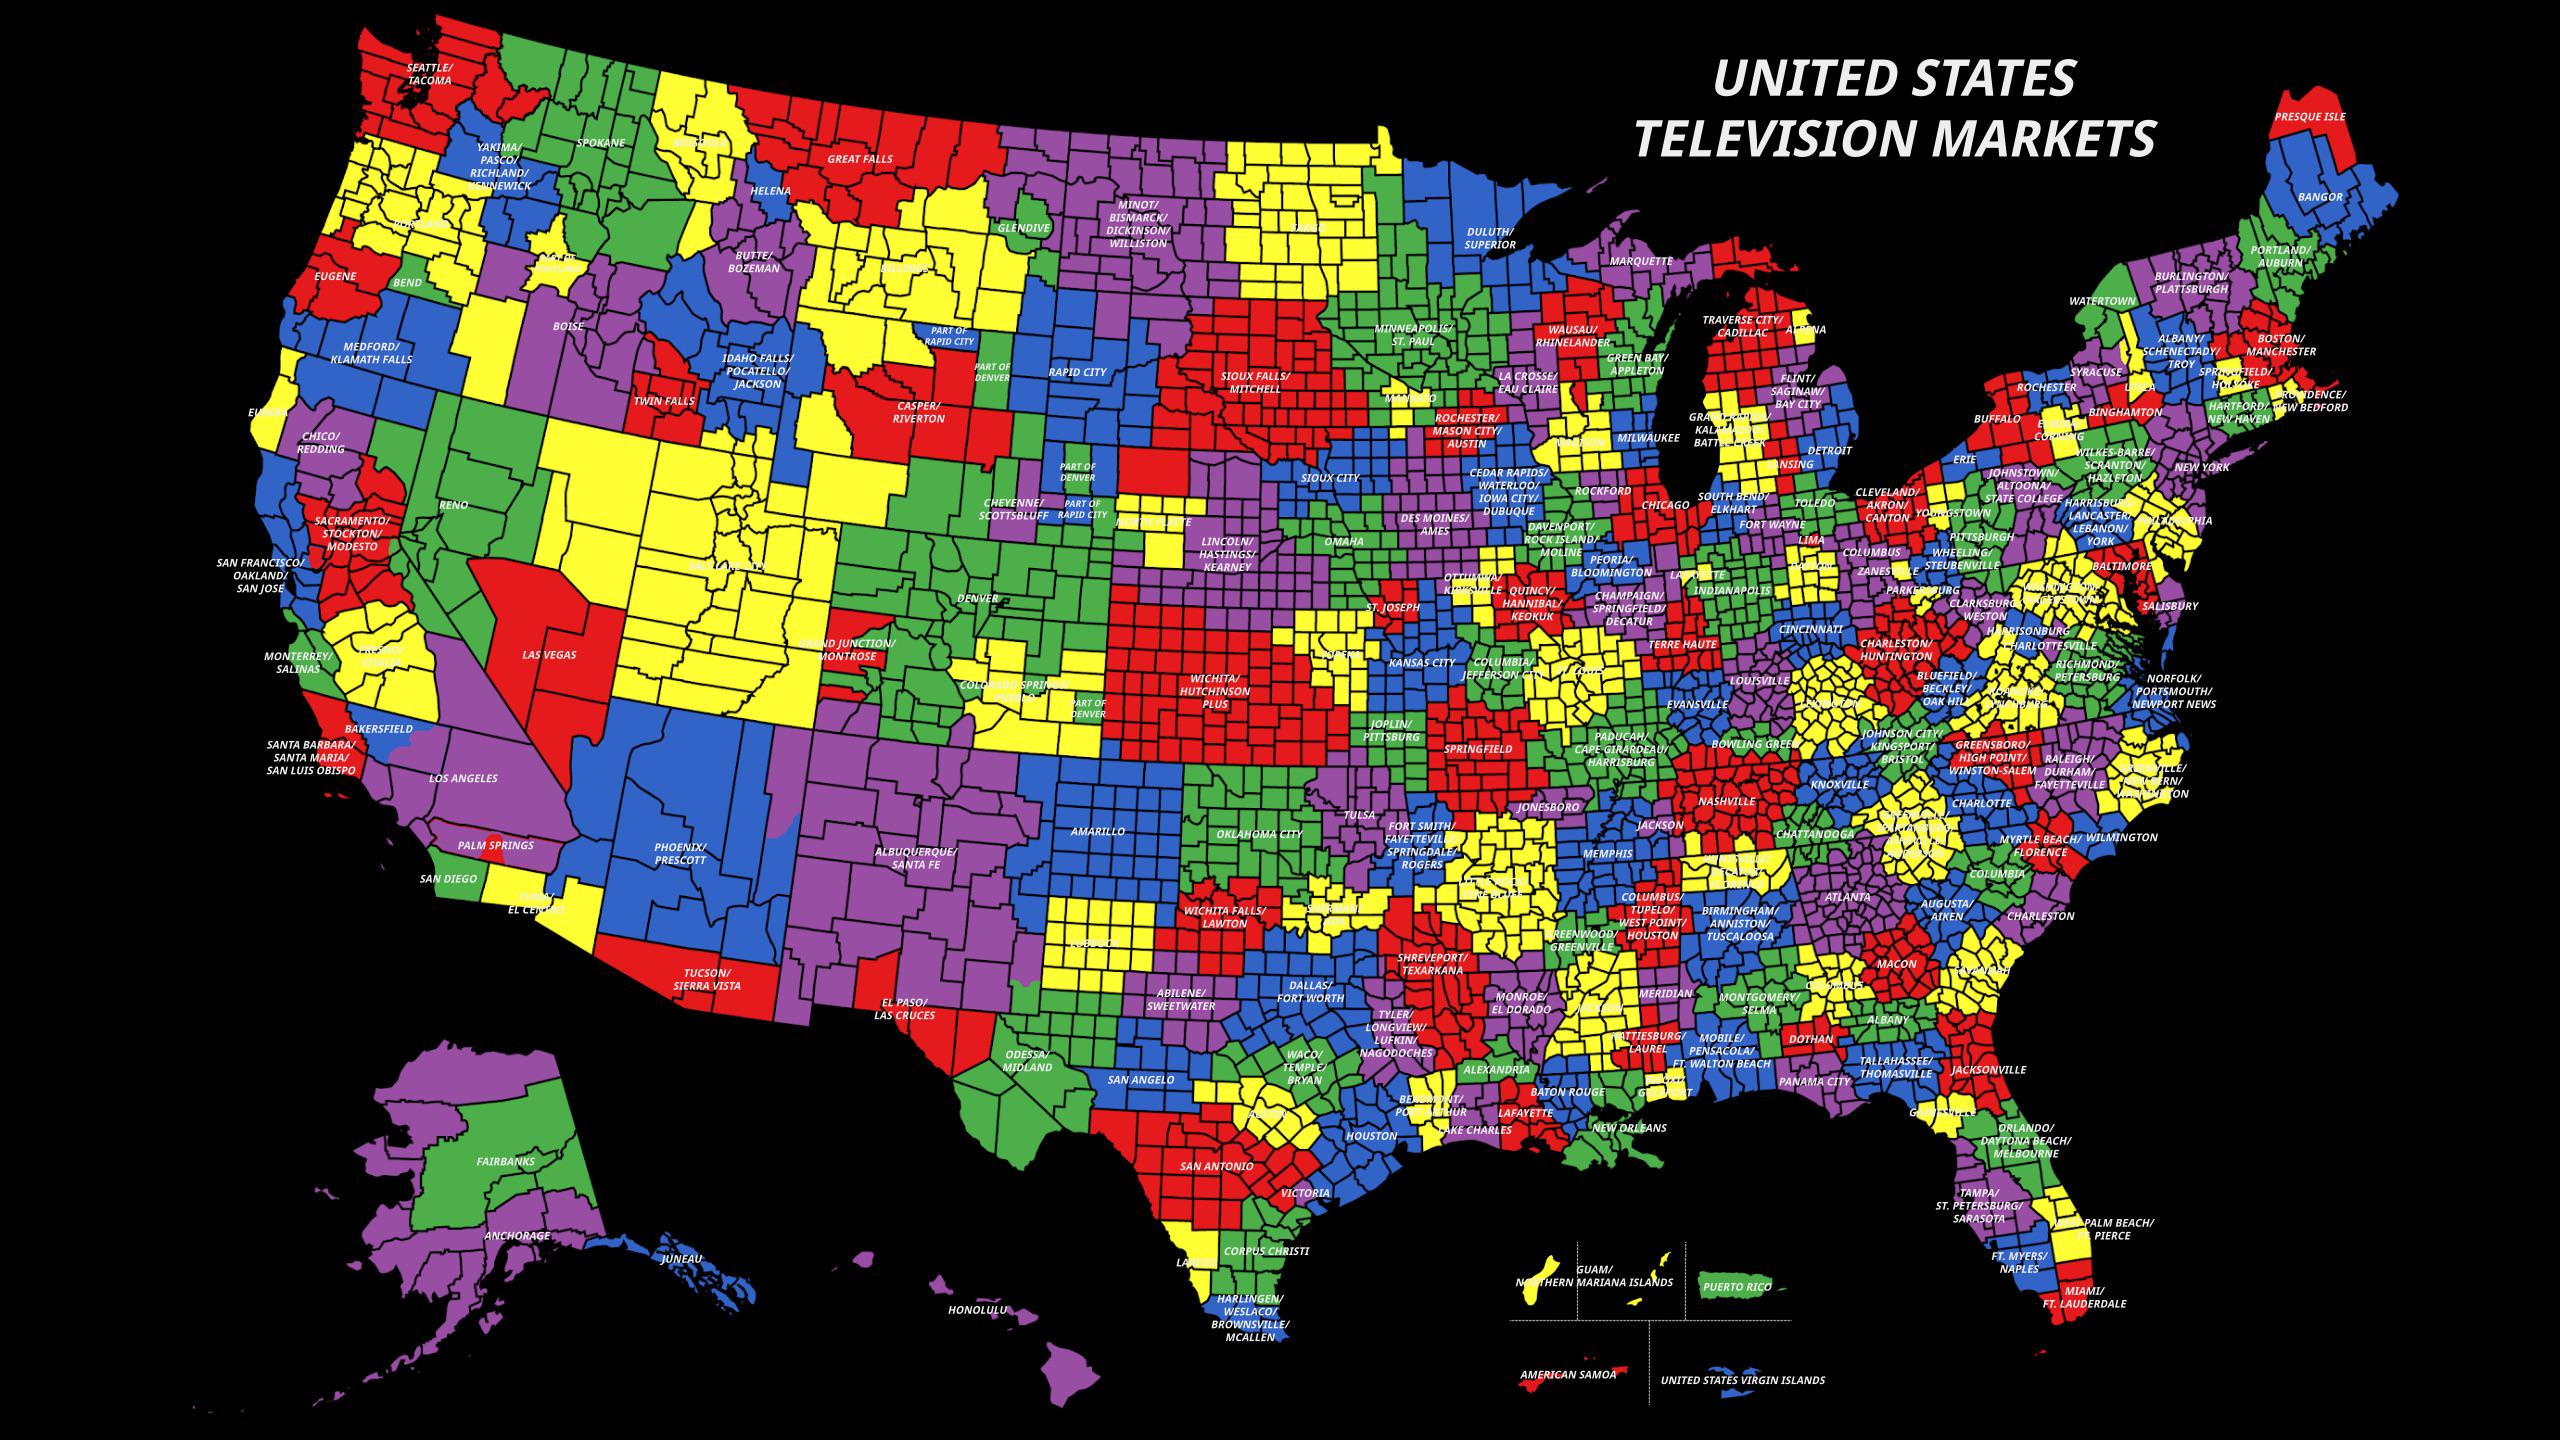
(ALT Text: US TV Markets Map Example - Colour coded map of the United States showing different designated market areas.) Caption: A visual representation of the US TV Markets Map, highlighting the DMAs across the country.
What is the US TV Markets Map?
The US TV markets map, also known as Designated Market Areas (DMAs), is a system developed by Nielsen, a leading global measurement and data analytics company. Each DMA represents a specific geographic area consisting of counties in which the households primarily receive broadcast television stations originating from the same area. In simpler terms, it defines the regions where local TV stations have the strongest influence.
How is the US TV Markets Map Defined?
Nielsen determines DMAs primarily based on viewing patterns. They analyze which TV stations are most watched within each county and group counties together that share the same dominant stations. Population size is a significant factor, but it's not the only determinant. Other considerations include:
- Signal strength: The strength and reach of broadcast signals from various TV stations.
- Cable penetration: The prevalence of cable television within the region.
- Viewing habits: Nielsen tracks what people are actually watching, using meters and other measurement technologies.
DMAs are recalculated annually, meaning that their boundaries can shift based on changes in viewing habits, population distribution, and the emergence of new television stations.
(ALT Text: Nielsen Logo - The Nielsen logo, a well-known brand in media measurement.) Caption: Nielsen, the company responsible for defining and maintaining the US TV Markets Map.
The Importance of the US TV Markets Map for Advertisers
Advertisers rely heavily on the US TV markets map to target their commercials effectively. By understanding which DMAs have the highest concentration of their target audience, they can tailor their advertising campaigns to specific regions, optimizing their reach and return on investment. Here are some ways advertisers use DMAs:
- Local Advertising: Businesses targeting specific communities use DMAs to run ads on local TV channels that resonate with their target customers.
- National Campaigns: National advertisers use DMA data to adjust their messaging and media buys based on regional preferences and demographics.
- Test Marketing: Companies use DMAs to test new products or advertising campaigns in a controlled environment before rolling them out nationwide.
The Impact of the US TV Markets Map on TV Programming
The US TV markets map also influences the types of TV programs that are produced and distributed. Networks often tailor their programming to cater to the interests of viewers in specific DMAs. This can manifest in several ways:
- Local News: Local news stations provide coverage of events and issues that are relevant to their DMA.
- Syndicated Programming: Syndicated TV shows are often sold to stations in specific DMAs, allowing them to fill their programming schedules with content that appeals to local viewers.
- Sports Broadcasting: The broadcast of sporting events is heavily influenced by DMA boundaries. For example, a local team's games are often broadcast exclusively within their DMA.
(ALT Text: A Local News Broadcast - Image of a local news anchor presenting the news on a local television station.) Caption: Local news programs are tailored to the specific interests and concerns of viewers within their DMA.
How Streaming Services Fit Into the US TV Markets Map
While streaming services are not directly bound by DMA boundaries in the same way as traditional broadcast TV, the US TV markets map still plays a role in their operations. Streaming services use DMA data to:
- Personalize Content: Some streaming services personalize their content recommendations based on the DMA in which the user is located.
- Target Advertising: Streaming services that offer ad-supported plans use DMA data to target advertising to viewers.
- Local Content Acquisition: Streaming services may acquire local content, such as regional documentaries or independent films, to appeal to viewers in specific DMAs.
Challenges and Changes to the US TV Markets Map
The US TV markets map is not without its challenges. Some critics argue that it is becoming less relevant in the age of streaming, as viewers have access to a wider range of content from around the world. Additionally, the increasing fragmentation of the media landscape and the rise of cord-cutting are making it more difficult for Nielsen to accurately measure viewing habits.
Despite these challenges, the US TV markets map remains an important tool for advertisers, TV networks, and streaming services. It provides valuable insights into viewer behavior and helps them to make informed decisions about programming and advertising. As the media landscape continues to evolve, the US TV markets map will likely continue to adapt to meet the changing needs of the industry.
(ALT Text: Cord Cutting Concept - Image illustrating the concept of cord-cutting, with cables being disconnected from a television.) Caption: The rise of cord-cutting presents a challenge to traditional DMA measurement methods.
Celebrities and Local Markets:
The US TV markets map isn't just about news and advertising; it also plays a role in how celebrities connect with their fans. Here's how:
- Promotional Tours: Celebrities often embark on promotional tours, targeting specific DMAs with strong media outlets and fan bases.
- Local Appearances: Appearances on local TV and radio shows within a DMA can significantly boost a celebrity's visibility and popularity in that region.
- Targeted Social Media: While social media is global, celebrities and their teams can tailor content to resonate with specific DMAs. For example, mentioning local landmarks or events.
Who is Ryan Seacrest? Ryan Seacrest is an American television host, radio personality, and producer. He is best known for hosting American Idol, Live with Kelly and Ryan, and On Air with Ryan Seacrest. He is also the host of American Top 40. Seacrest has won an Emmy Award for his work on American Idol and has been nominated for several other awards. He is one of the most successful and recognizable figures in the entertainment industry.
Conclusion: The Enduring Relevance of the US TV Markets Map
Even with the digital revolution shaking up the media landscape, the US TV markets map retains significant value. It offers advertisers targeted reach, influences the programming we see, and even affects how celebrities connect with their audiences. By understanding DMAs, viewers can gain deeper insight into the strategies behind the content they consume.
Q&A:
- Q: What is a DMA? A: A Designated Market Area (DMA) is a geographic region representing the area where local TV stations have the strongest influence.
- Q: Who created the US TV markets map? A: Nielsen.
- Q: How do advertisers use the US TV markets map? A: To target their commercials effectively to specific regions and demographics.
- Q: Does the US TV markets map affect streaming services? A: Yes, streaming services use DMA data for content personalization, ad targeting, and local content acquisition.
Keywords: US TV Markets Map, DMA, Nielsen, Television Advertising, Local TV, Streaming Services, TV Programming, Designated Market Area, TV Markets, Media Measurement. Summary : This article details the US TV Markets Map (DMA) by Nielsen, its importance to advertisers, influence on programming, and relevance in the streaming era, along with a Q&A.


Local Market Definitions Comscore Inc MarketMap U S Broadcast TV Markets By Size By U OwlDog17 Maps On The Web A5b252e2a2c96d1c7aab2c77d73e78bf76d2540f United States Television And Streaming Market Share Analysis Q2 2023 G1j9j88NR1ePki8iBEHE612 Best Nielsen Images On Pholder Old School Cool Mtgporn And Sewing Xqiiy59413351 The Many Moving Parts Of The Transition To NextGen TV TV Tech WbuckjVsj89DNjKj62n4yL 1200 75 US TV Market 2023 In One PagenScreenMedia 231114 US TV Market In One Page Q3 2023 List Of Television Stations In North America By Media Market Wikipedia 450px Canada TV Markets Map.svg United States Television And Streaming Market Share Analysis Q2 2023 9FRUAnhQQioUUMdHQfsX
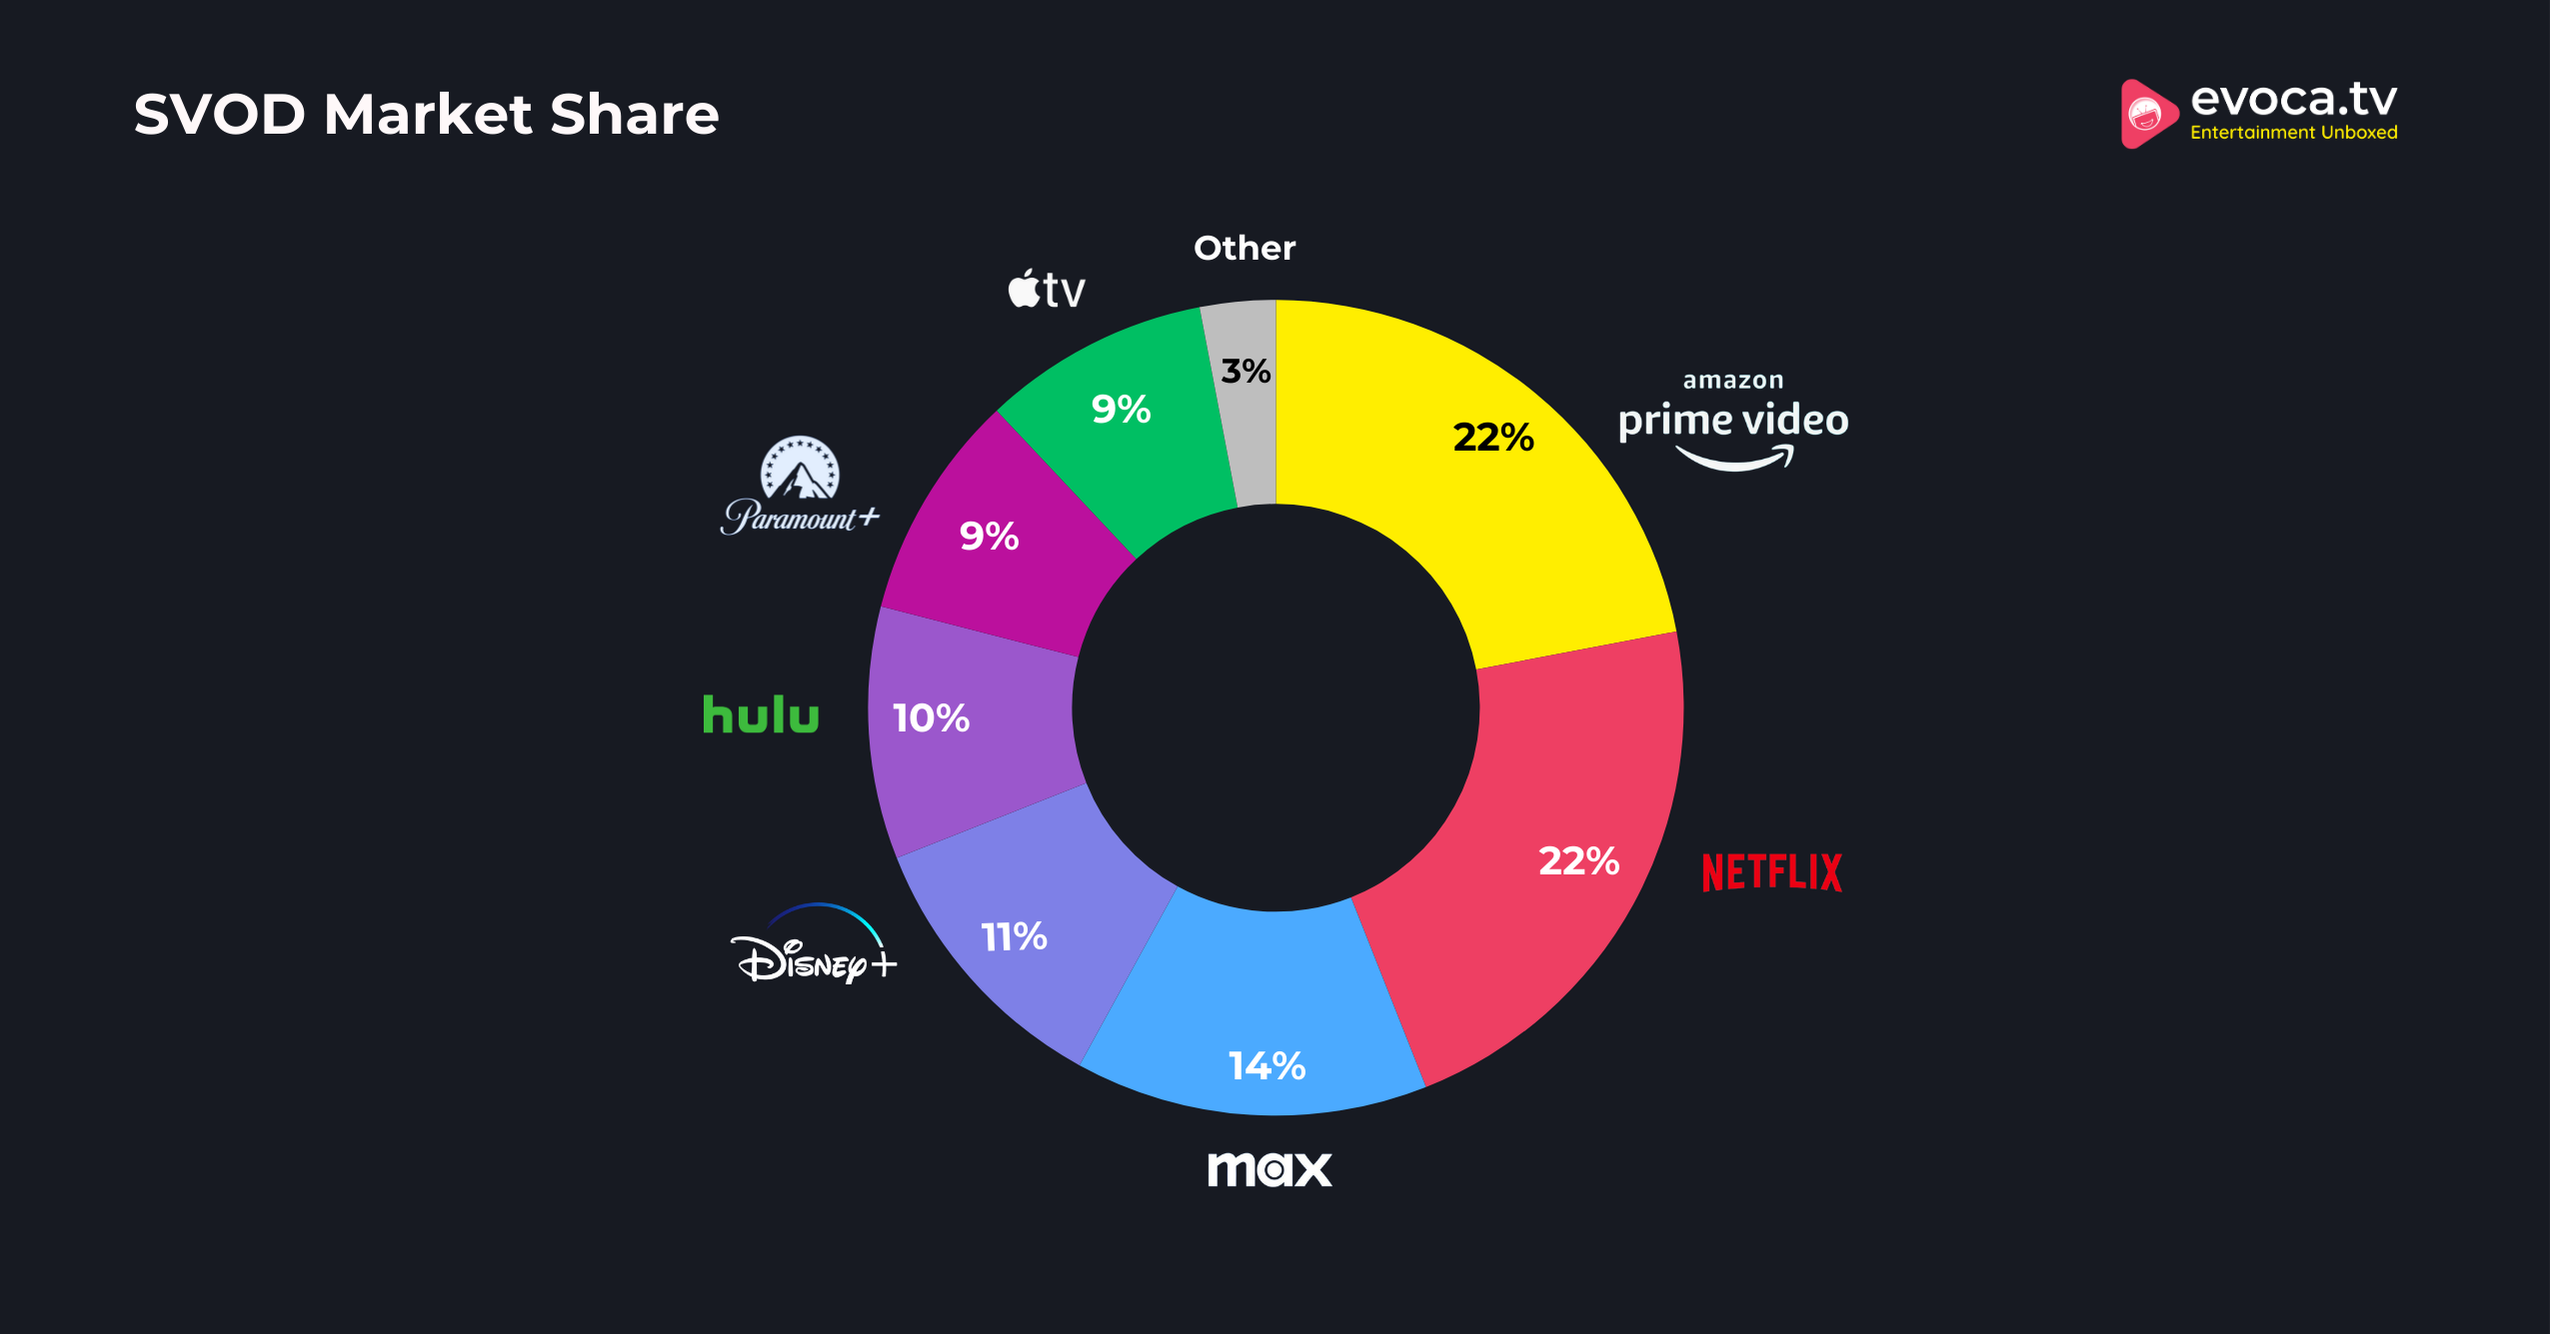
Map Of US Television Markets B1a52cffd04142a137128520e4583dac Paramount Plus Subscribers Statistics 2025 Active Users SVOD Market Share Connected TV Market Size Share Forecast Report 2024 2032 Us Connected Tv Market Size 2024 2032.webpUS Map Of Nielsen Television Markets Area Map Us Map Illustrated Map 50e67db58e3e62f79e3bc0fd06c0ac93 United States Television And Streaming Market Share Analysis 2022 J91HujtoQDm1NHXCtdnkConnected TV Market Size And Trend Analysis Including Segments Connected TV Market 1.webpGlobal TV Shipments Q22024tvshipments Small Television Market Size Share YoY Industry Growth 2034 Rd New Sec Col 1 Img.webp
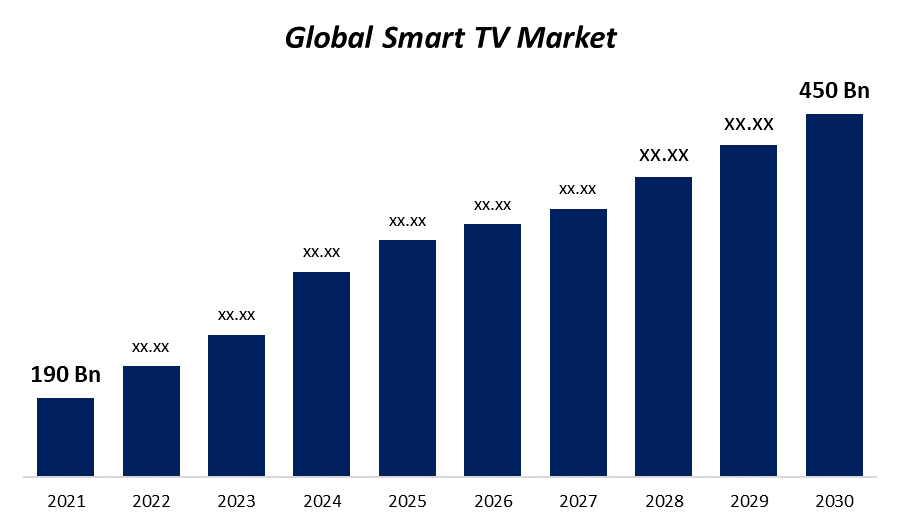
Television Market Size Share Report 2022 2028 Us Television Market North America Smart TV Market Size Share Forecast To 2032 North American Smart Tv Market Broadcast Tv Stations Map TVMarkets Contiguous US Best Tv On The Market For 2025 Stephen E Stanley Smart Tv Market Nfl Week 16 Tv Map 2025 Leilani Samira Week%2B16%2BFOX%2BEarly%2BGame File US TV Market Map Svg Wikimedia Commons 120px US TV Market Map.svg Smart TV Market Size Share Trends Forecast To 2032 Smart Tv Market Free DMA Map 2025 Media Market Map Free Media Market Map Designated Market Area DMA Map 768x402
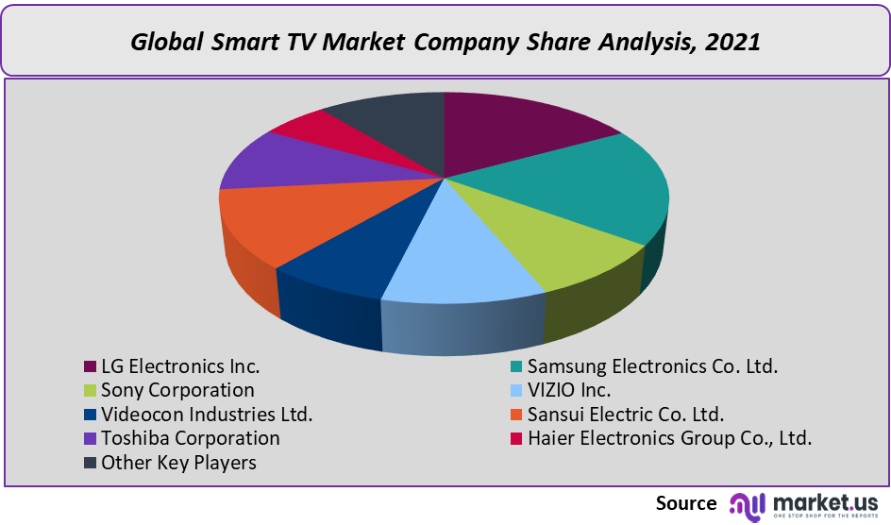
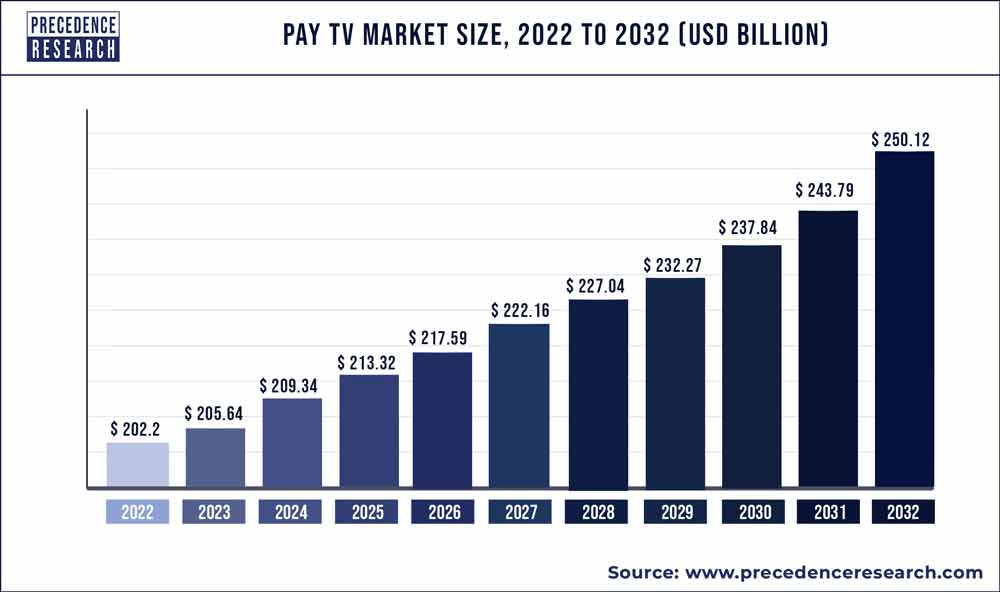
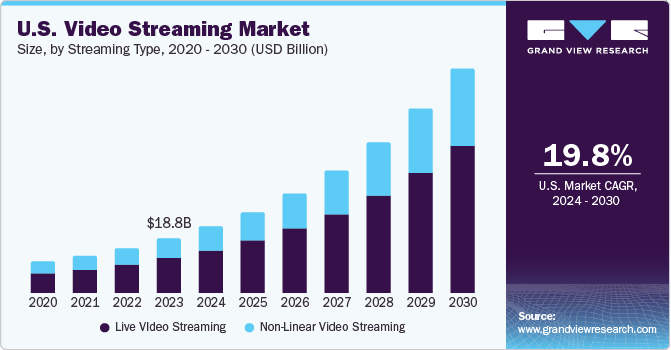
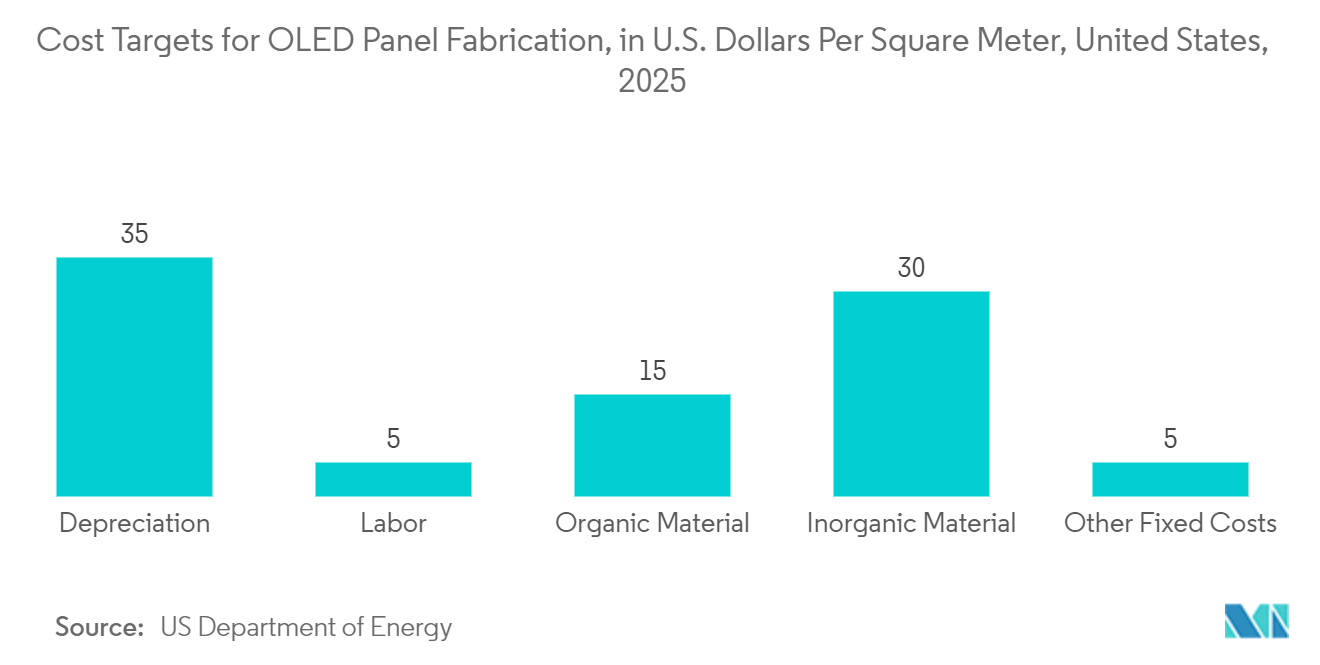
Pay TV Market Size To Hit Around US 250 12 Billion By 2032 Pay TV Market Size 2020 To 2030 CTA Bullish On 8K TV Market Growth In The US 8K Association Image 13 U S Video Streaming Market Size And Share Report 2030 Us Video Streaming Market US Smart TV Market Trends 1666356264046 United States Smart Tv Market Cost Targets For OLED Panel Fabrication In U.S. Dollars Per Square Meter United States 2025 Connected Television Market 2025 Trends And Forecast Connected Television Tv Market Report.webpIs CTV Share Of TV Ad Revenue Fair And Equitable NScreenMedia 240714 Number Of US Households Using Each TV Service Type In Q1 2024 Market Map Designated Market Map 210 Areas Smart TV Market Size Share Trends Forecast To 2032 Smart Tv Market Company Share Analysis
The Daily Kos Elections Guide To Media Markets And Congressional Mediamarketfromshapefilemap3 Nfl Markets Map Arleen Michelle Goldsberry Feature Nflmaps 2 Mobile2 Television Markets Of The United States Mapped Vivid Maps Television Markets Of The United States